Observability with PopUp Mainframe
"Observability is the ability to understand the internal state or condition of a complex system based solely on knowledge of its external outputs, specifically its telemetry."
Source: IBM. What is observability?
The ability to understand the state of our systems, to see what 'normal' and 'not normal' looks like, helps us to make better decisions, use our resources more efficiently, and reduce waste.
Our goal at PopUp is to simplify and accelerate every part of development and testing on z/OS. Ensuring that the devtest environments are available and functioning as expected is core to a functional platform.
Observing your PopUps
We can help you stand up a simple and effective observability solution for PopUps using Prometheus and Grafana. PopUp images are shipped with the Prometheus node-exporter agent pre-installed so the PopUp can be 'just another Linux VM' in terms of observability at the Linux level. We provide out-of-the-box features so you can understand how your PopUp environments are functioning at the z/OS level too.
Our observability solution can help you...
At the z/OS level:
- Full z/OS health check report covering system integrity, tool validation and operations readiness
- DASD storage usage - showing % used for each DASD volume by storage group, SMS, non-SMS and spool volumes
- License tracker - showing license expiry date, number of PopUp licenses currently consumed with details of consumers
- Inventory of your PopUp estate - including z/OS version, z/OS status, ZD&T version, etc.
- DASD volume config
- Subsystem config and status
At the Linux level:
- Infrastructure metrics - including CPU, memory and disk usage for the VM
- Inventory of your PopUp estate - including VM config
We are expanding the dashboards available all the time. Contact us to find out how we can help if you have a specific requirement.
Why Grafana and Prometheus?
Grafana and Prometheus are industry‑leading, open‑source tools that are widely adopted across modern software organizations, from startups to large enterprises. They have large, active communities and a mature ecosystem of integrations, which reduces vendor lock‑in and ensures long‑term sustainability. Together, they form a scalable, battle‑tested observability stack that aligns well with modern DevOps and SRE practices, enabling teams to understand system behavior, troubleshoot incidents faster, and continuously improve reliability.
Getting started
There are multiple ways you can achieve an observability solution with the PopUp. Below is one architecture option.
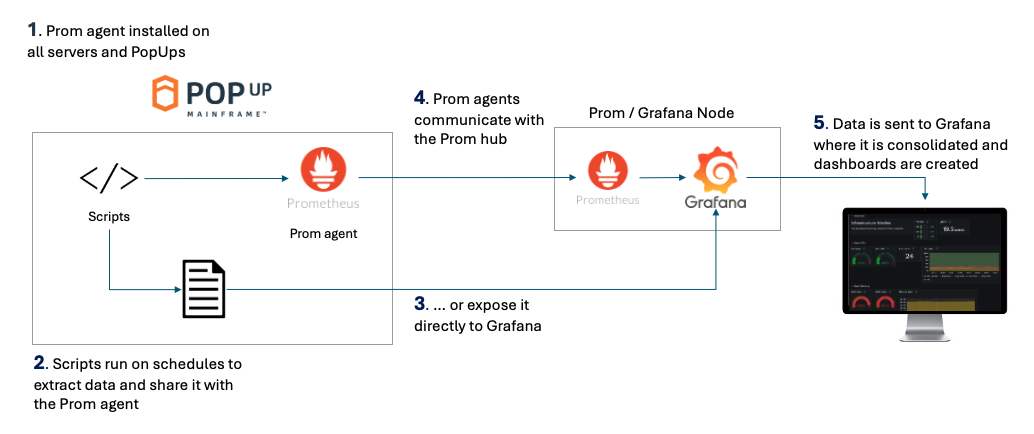
- PopUp Mainframe comes with the Prometheus agent installed out of the box, so it is ready to be integrated into an existing Prometheus setup
- We can provide scripts to extract metrics and data from your PopUps. This is then shared with the Prometheus agent.
- Data can be shared directly with Grafana if desired, for example via a web server.
- Prometheus target nodes send the data back to the Prometheus hub. In this instance Grafana is running on the same VM as Prometheus.
- Users login to the Grafana dashboard via a browser.
Of course, this is only one possible solution, many other options and technologies are available. We can support you to achieve the observability solution which is right for your team.
If you already have a Grafana stack in your organization, it is simple to integrate the PopUp - we can provide Grafana JSON dashboard files, as well as scripts to extract the data you need from the PopUps. If you already have Prometheus in your organization, the PopUp VMs can be added to your Prometheus node easily.
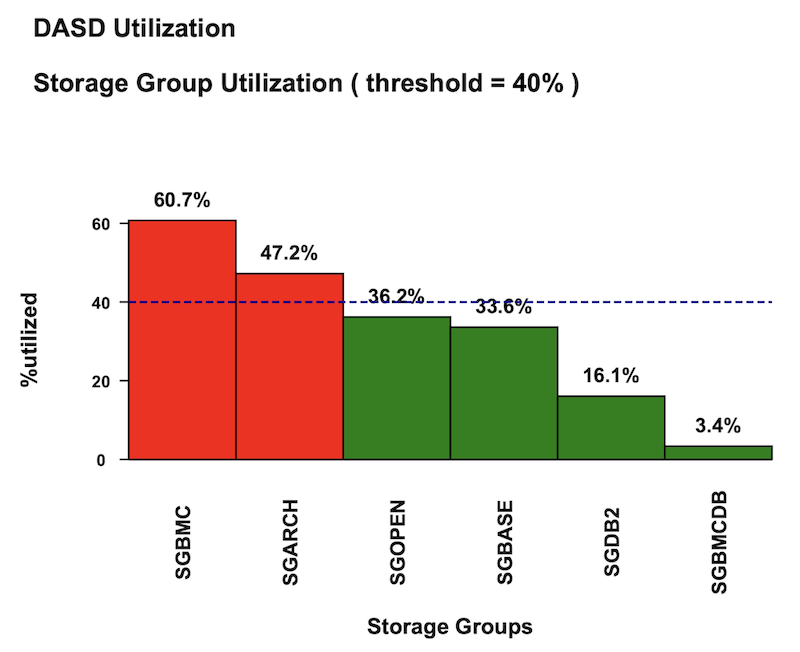
Example dashboard: DASD usage and volume usage
One of the many dashboards we can provide you shows DASD storage utilisation. This dashboard includes:
- DASD usage, averaged by storage group
- SMS storage group usage
- Non-SMS volumes usage
- Spool volume usage
- Volumes utilised over a configurable threshold
This data is generated by an Ansible playbook, and can be made available in the Grafana dashboard and emailed as a PDF report.
See below for an example extract of one of the DASD reports:
Best practices
An effective observability solution will look different for every team. We can help you design and build a solution which meets your exact requirements.
Follow these best practices and guiding principles to get the most out of your PopUps:
- Define your observability goals first, by deciding which questions you need to answer
- Avoid over-collecting metrics which will not help answer your guiding questions
- Treat dashboards as code
- Ensure all alerts are actionable
For more guidance on building an observability solution for your PopUps, and example dashboard JSON code, reach out to the PopUp team.
References and Further Reading
There is plenty of information available on Prometheus and Grafana as well as observing z/OS systems. These links may be useful:
- Details on the Ansible playbooks used with some of the dashboards
- Prometheus documentation
- Grafana documentation
Page last revised on: 2026-04-02